01 / Power acquisition
Interconnection Queue & NTP Speed Ranker
Compare five US grid regions by study timelines, queued capacity, and illustrative power acquisition potential.
Illustrative model · Supplied assumptions
Open toolDavid Levesque, B.S.E.E. — Austin, Texas
Business Engineer bridging utility modeling, policy, and business operations with AI. Energy, Opportunity, and Justice for All!
 DL
First principles
Deploying frontier compute requires fast, low-cost, scalable power acquisition. I build the AI tools, analytical engines, and commercial structures to execute at scale.
ENERGY TOOLS & MODELS MADE WITH AI
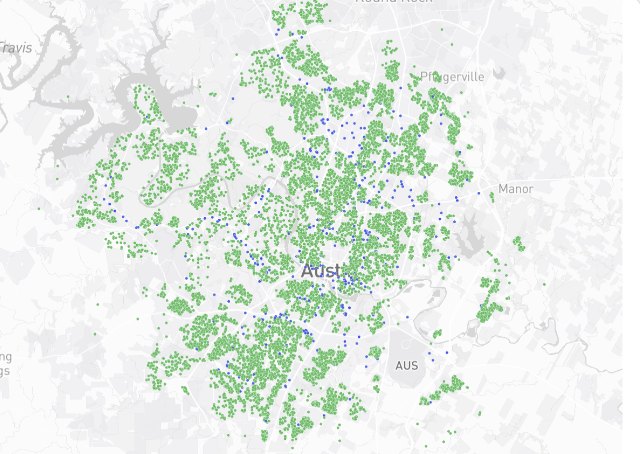
Real-time solar adoption map, kWh generation and time to permit charts. I worked with a team of two others on this project.
Sources: City of Austin solar permits + TCAD property records; EIA Form 923 (net generation).
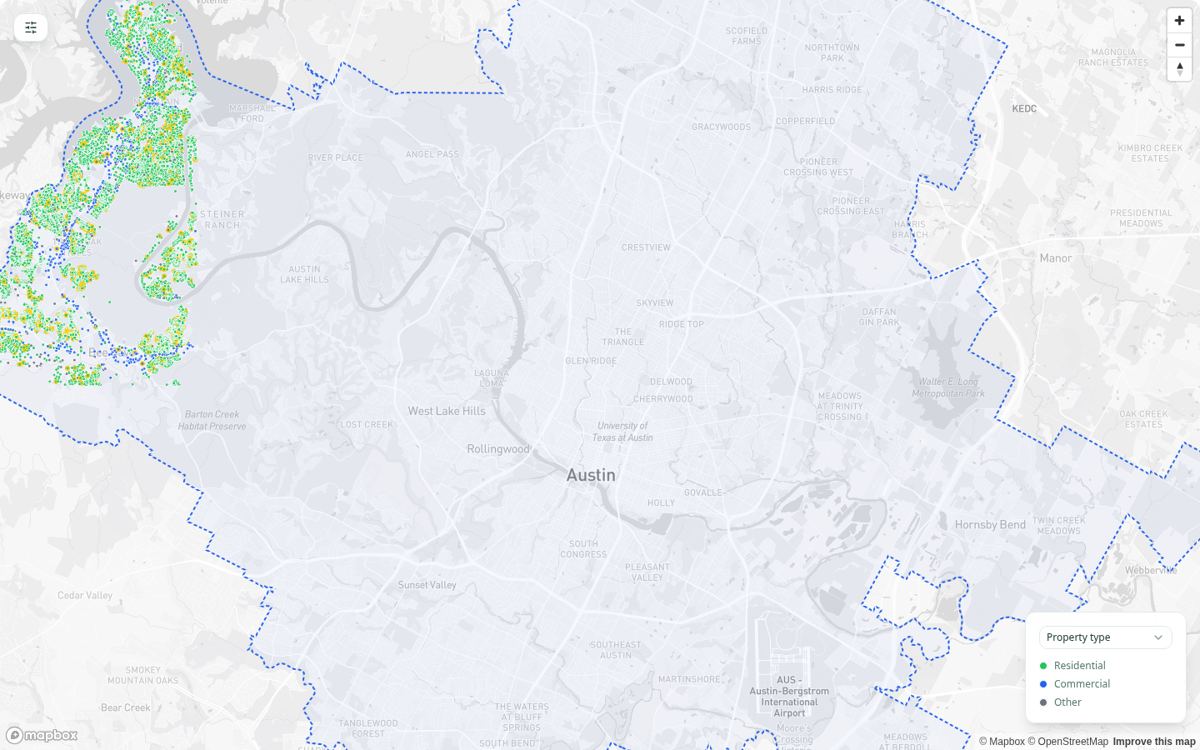
View Solar ProgressFull-screen map — zoom into any Austin property to see its solar status and potential, filterable by value, year built, or council district. I worked with one other developer on this project. My role was to define the problem and guide the development.
Sources: TCAD property records + City of Austin solar permits, rendered on a Mapbox/OpenStreetMap base.
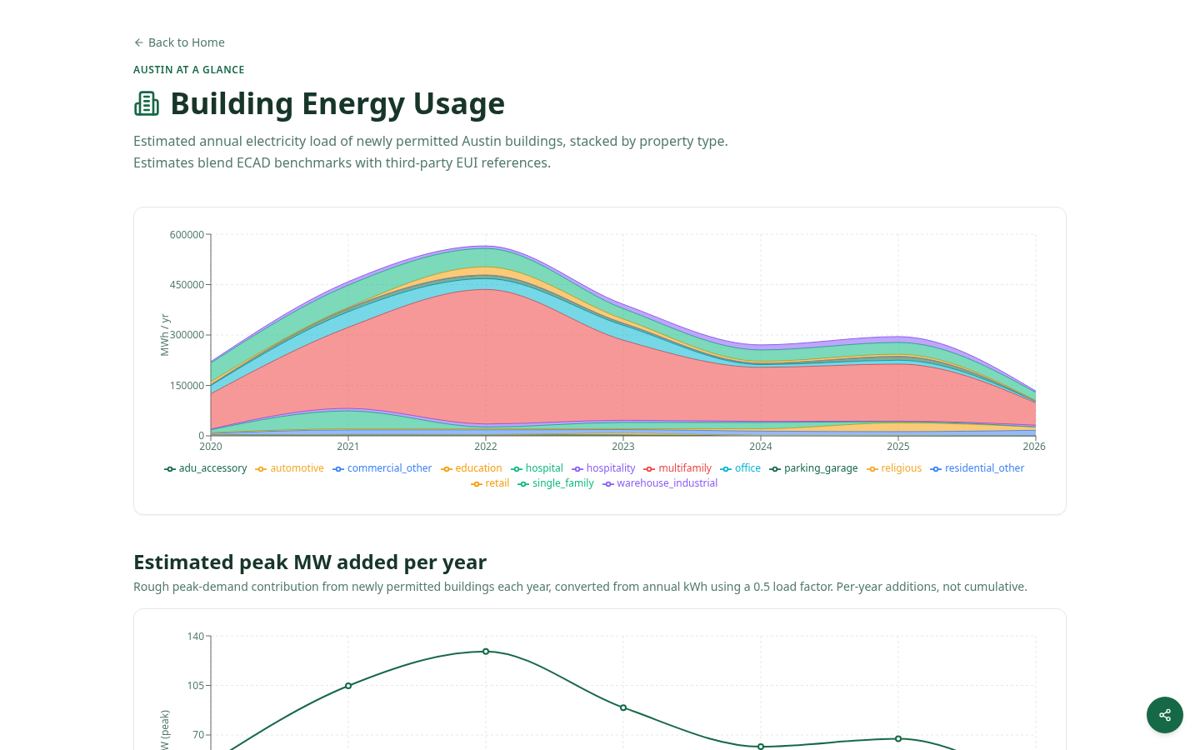
Explore Property MapEstimated annual electricity load added by newly permitted Austin buildings, stacked by property type, with a permit-level downloadable table. I ran a hackathon weekend, where I set this outcome as a goal and worked with a developer to guide the final version.
Sources: City of Austin building permits, converted with ECAD benchmarks and third-party EUI (energy-use-intensity) references.
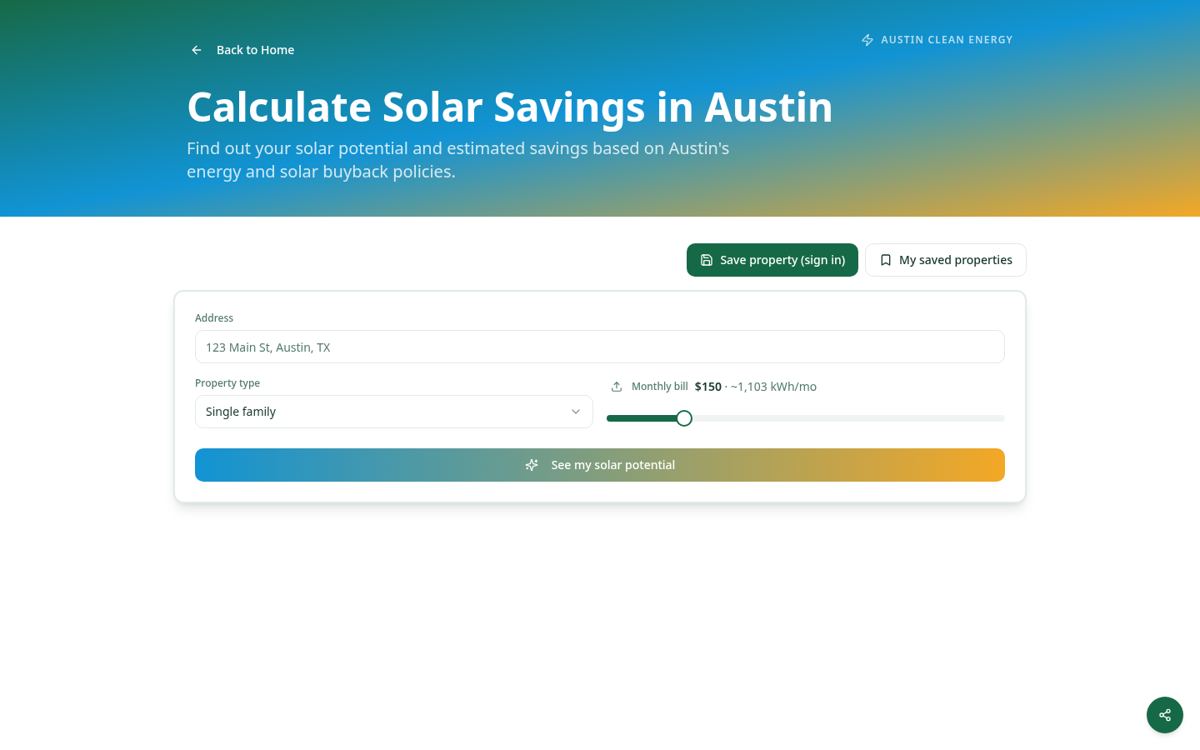
Calculate Building LoadAddress-driven: enter your address and monthly bill, get your roof's solar potential and estimated savings under Austin's buyback policy.
Sources: Property/roof data (Google Project Sunroof–style), Austin Energy's published rate and solar buyback policy.
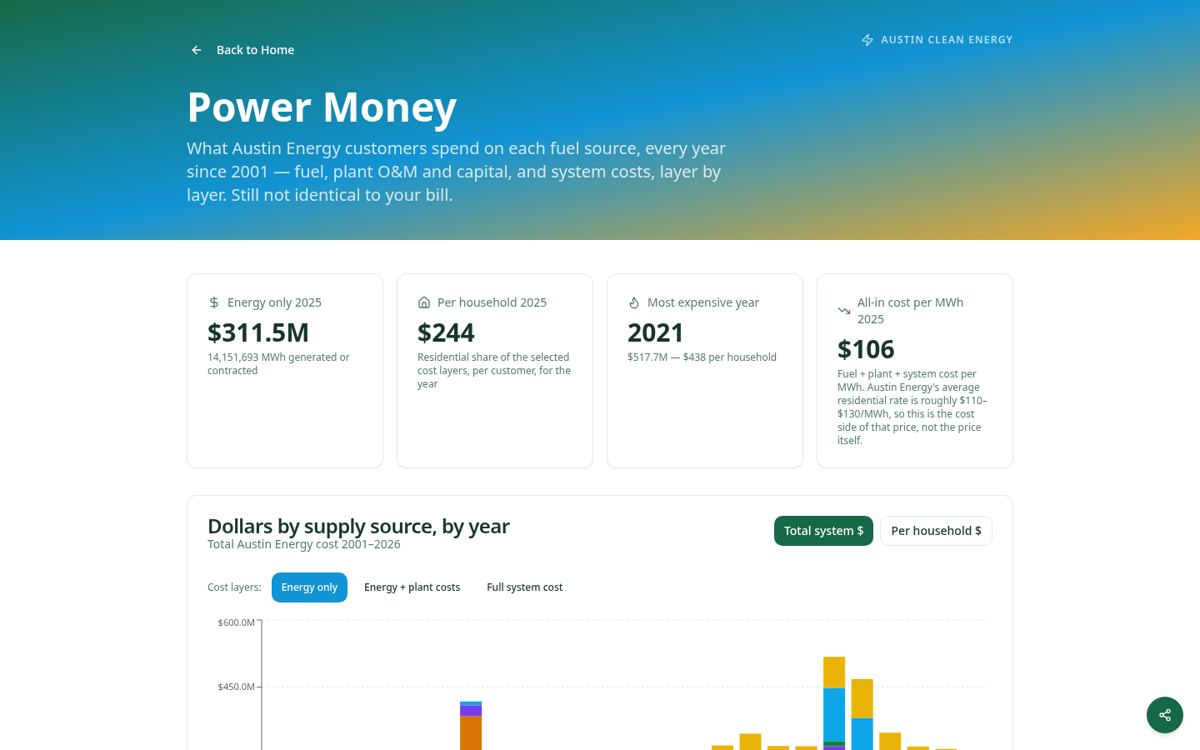
Assess Solar SavingsWhat Austin Energy customers spend on each fuel source every year since 2001 — fuel only, +plant O&M/capital, or full system cost, layer by layer.
Sources: EIA fuel-cost data + Austin Energy contracted-energy pricing; this is the same dataset the IRP Planning tool's cost-layer formula is calibrated against.
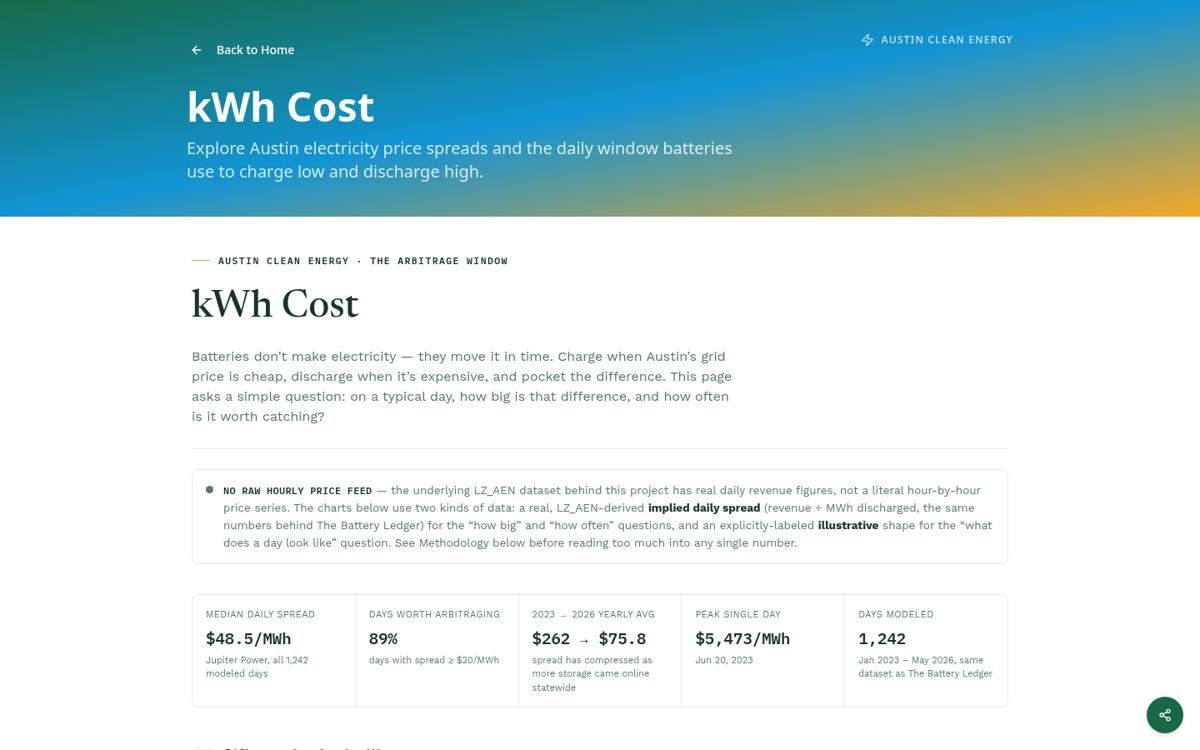
Explore Energy CostsExplores Austin's electricity price spreads and the daily window batteries use to charge low/discharge high — real derived daily spread, duration curve, and an explicitly-labeled illustrative hour-of-day shape.
Sources: LZ_AEN (ERCOT load zone) derived daily arbitrage revenue, 1,242 modeled days, Jan 2023–May 2026.
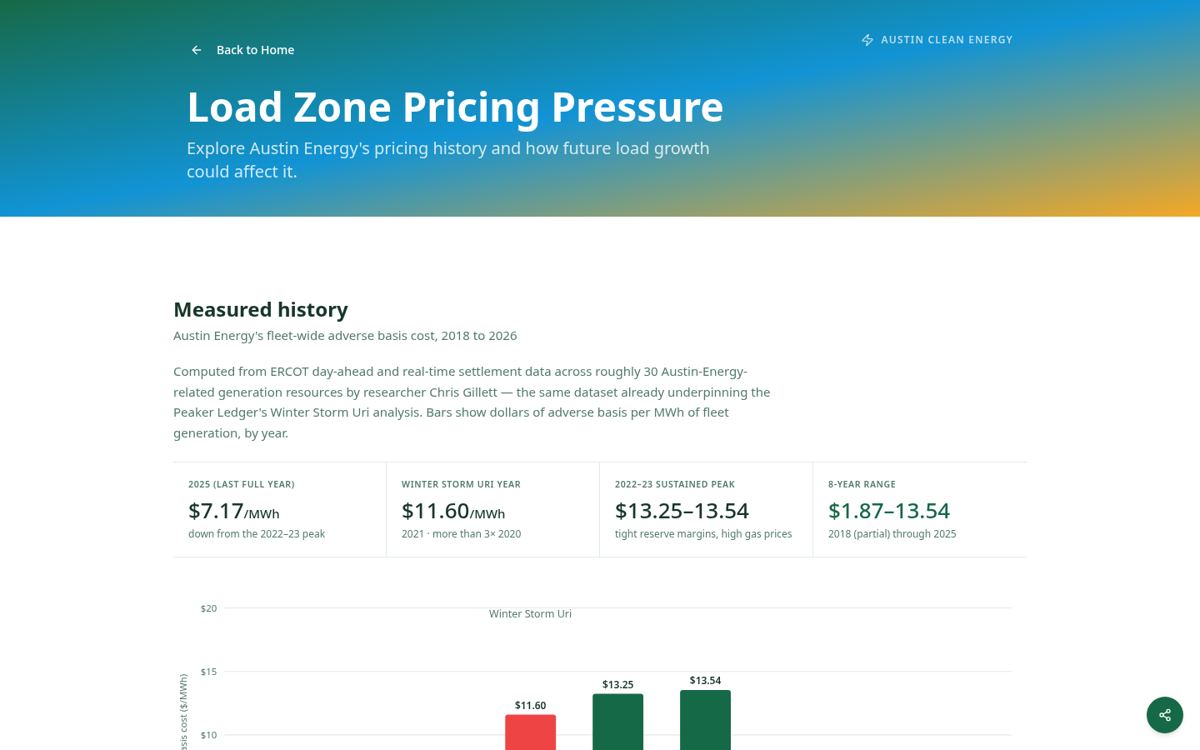
Explore Battery ArbitrageAustin Energy's fleet-wide "adverse basis" cost (what local generation costs above the ERCOT hub price) from 2018 through 2026, plus a forward scenario for how load growth could push it higher.
Data: ERCOT day-ahead and real-time settlement data across ~30 Austin-Energy-related generation resources, computed by researcher Chris Gillett — the same dataset behind the Peaker Ledger's Winter Storm Uri analysis.
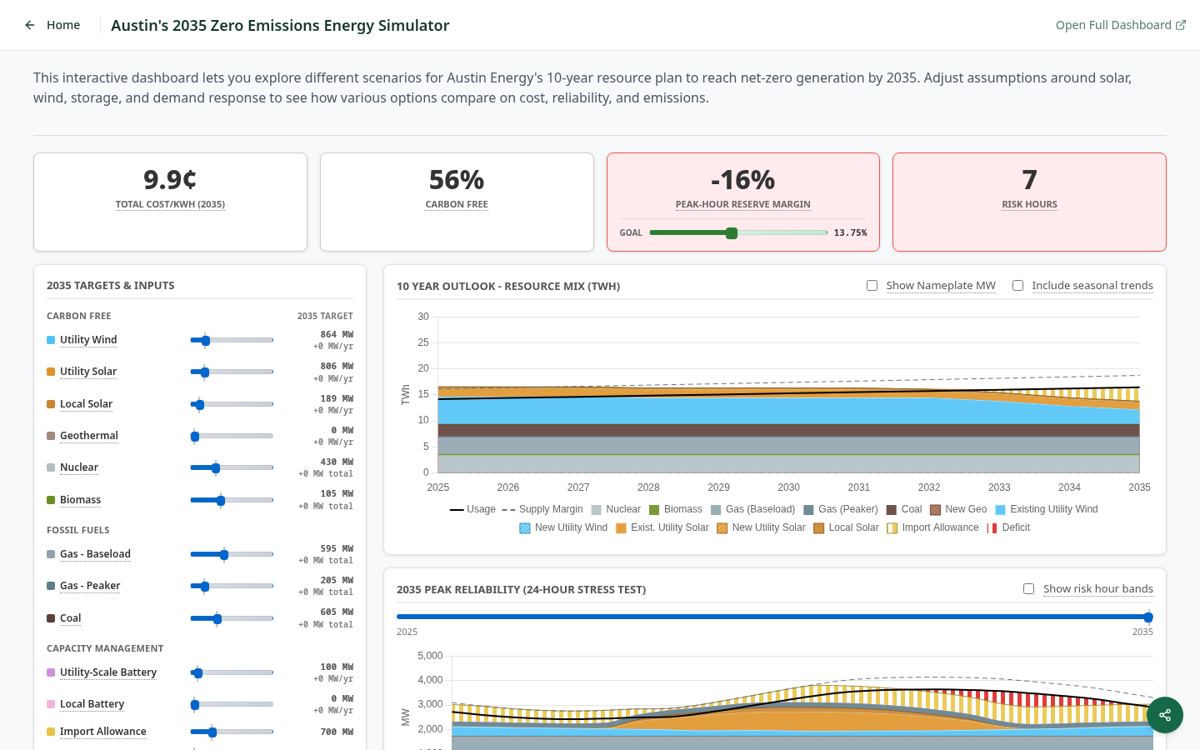
View Pricing PressureAustin's 2035 Zero Emissions Energy Simulator — slider-adjustable 10-year resource plan (wind, solar, storage, demand response, gas, coal, nuclear, biomass targets) with live cost, carbon-free %, peak-hour reserve margin, and a 24-hour stress test.
Data: Austin Energy's current resource mix as a baseline, with cost/reliability relationships the tool computes from user-adjusted targets — closest existing analog to the IRP Planning Interface tool, though built independently and already live.
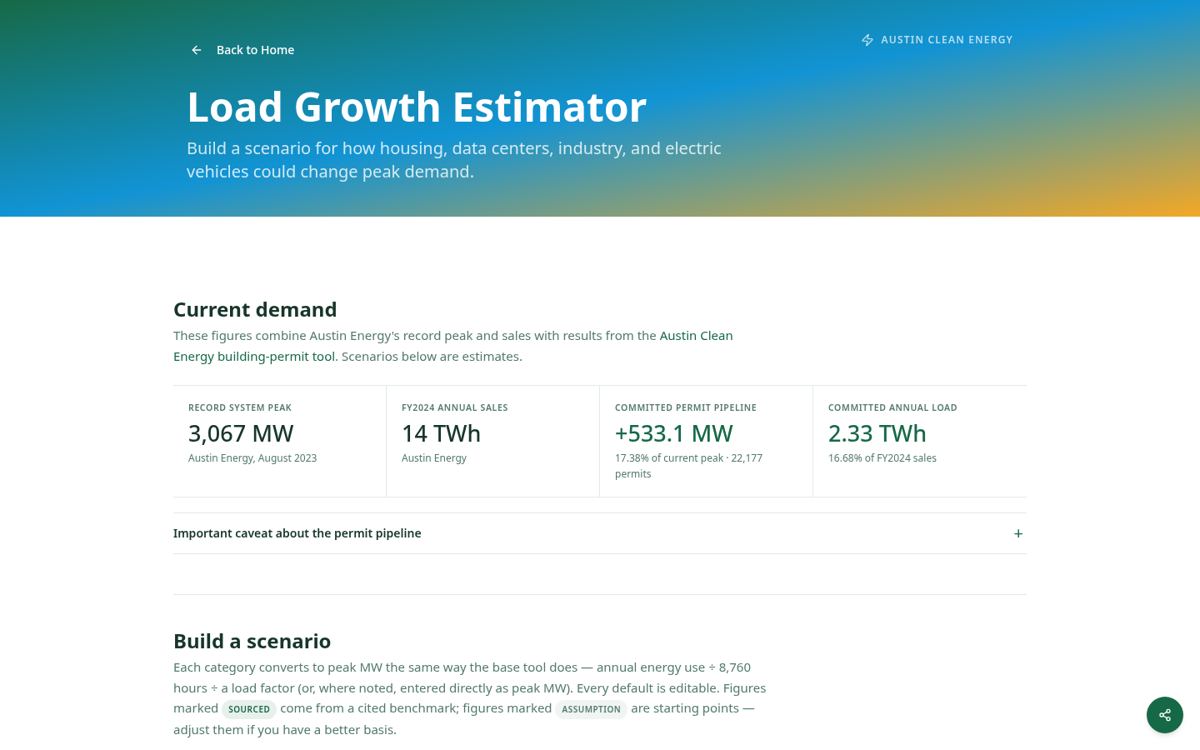
Launch Energy SimulatorBuild-your-own scenario: how housing, data centers, industry, manufacturing, and EV fleet charging could add to Austin's peak demand, each category editable with sourced or assumption-flagged defaults.
Data: Austin Energy's record peak (Aug 2023) and FY2024 sales; EIA RECS Texas averages; the City's building-permit tool; a City staff memo on data-center sizing.
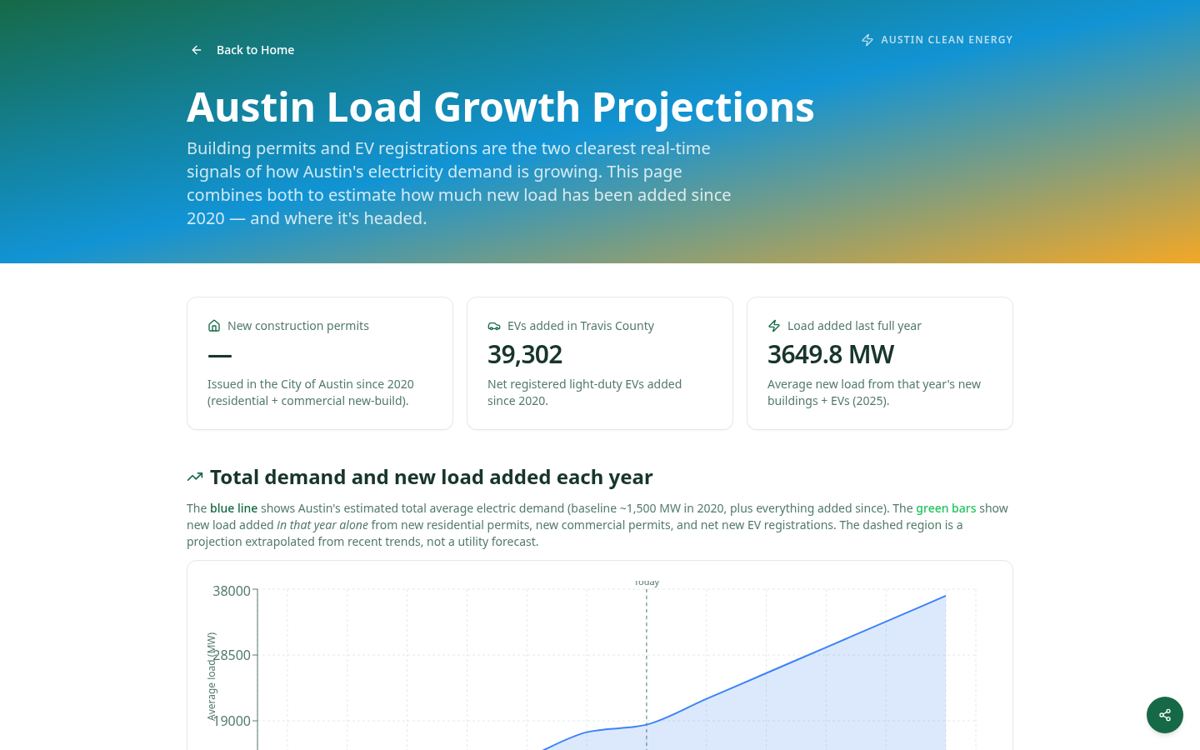
Build Load ScenarioA real-time-ish companion to the Estimator: combines actual building permits and EV registrations since 2020 into a running estimate of new load added per year, with a trend-extrapolated projection to 2031.
Data: Live City of Austin permits dataset (3syk-w9eu) + Atlas EV Hub/TxDMV EV registrations.
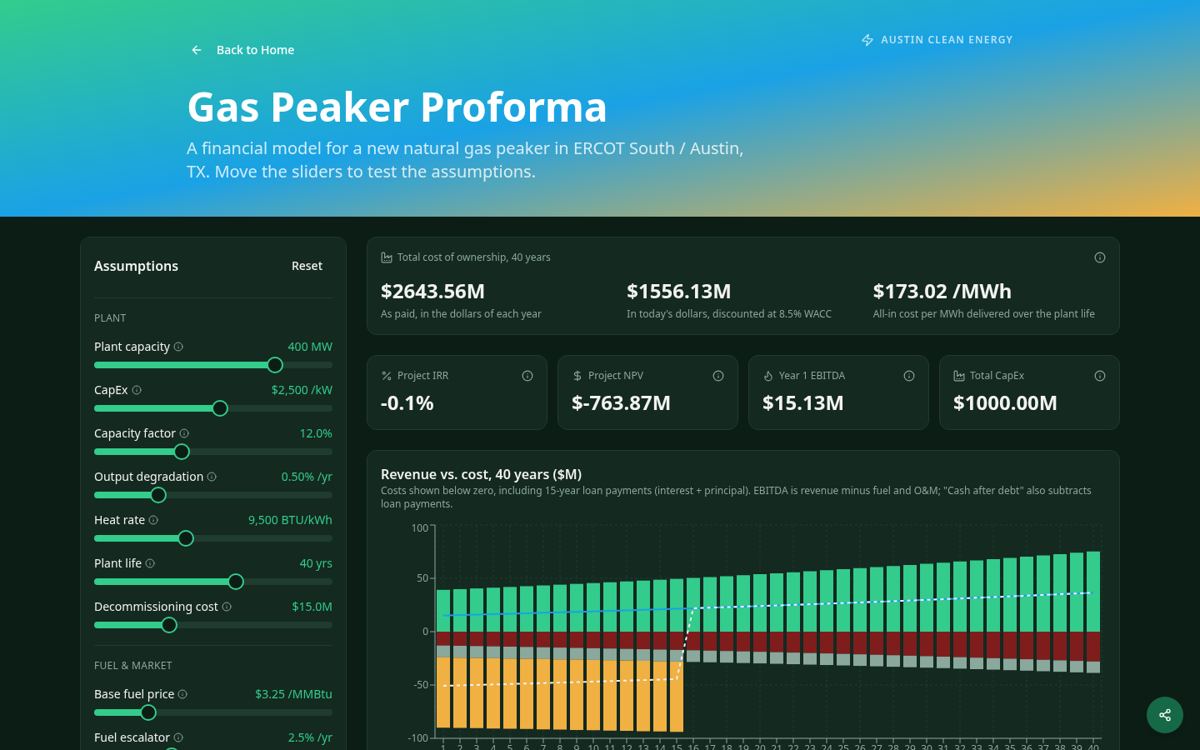
View Load ProjectionsInteractive 40-year (displayed; described as 20-year model) financial model for a new ERCOT South gas peaker — IRR, NPV, EBITDA, debt service, full annual schedule, slider-adjustable assumptions.
Data: Modeled capex/heat-rate/capacity-factor assumptions for a representative ERCOT South peaker; not a specific disclosed AE contract.
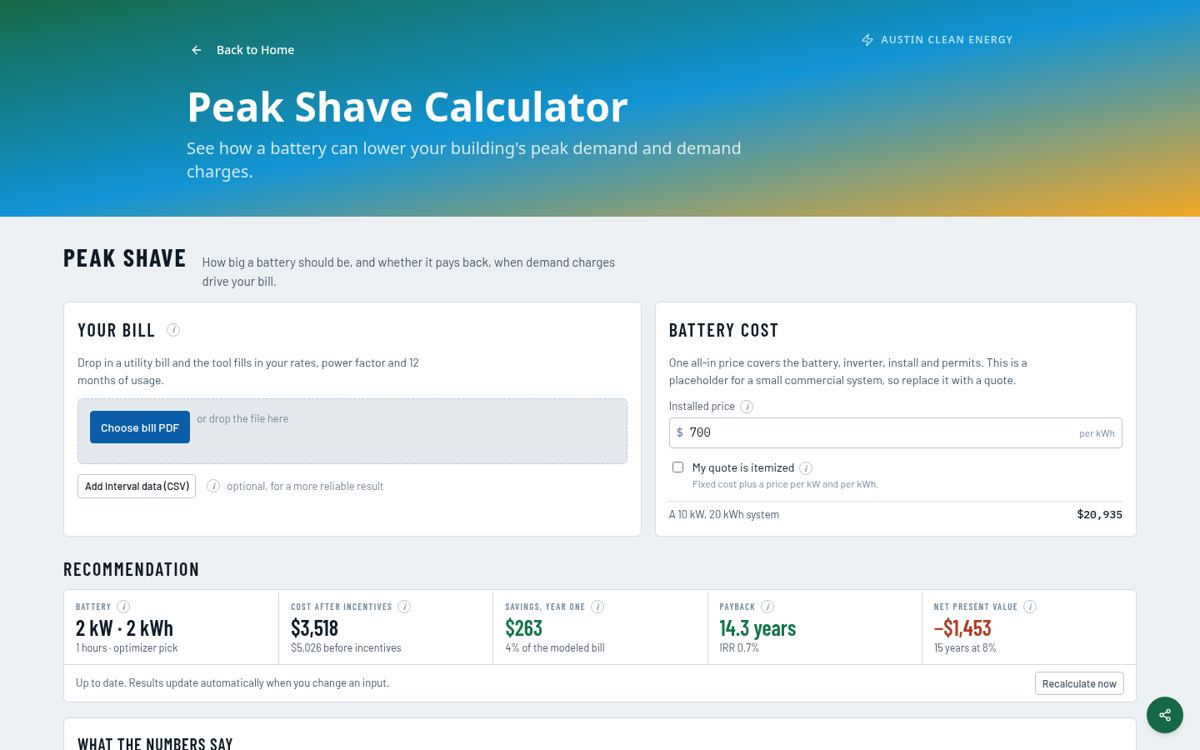
Model Peaker EconomicsUpload a commercial utility bill (or enter interval data) and the tool estimates how a battery sized for your demand charges would pay back.
Data: User-uploaded bill PDF, parsed against Austin Energy's commercial demand-charge rate structure.
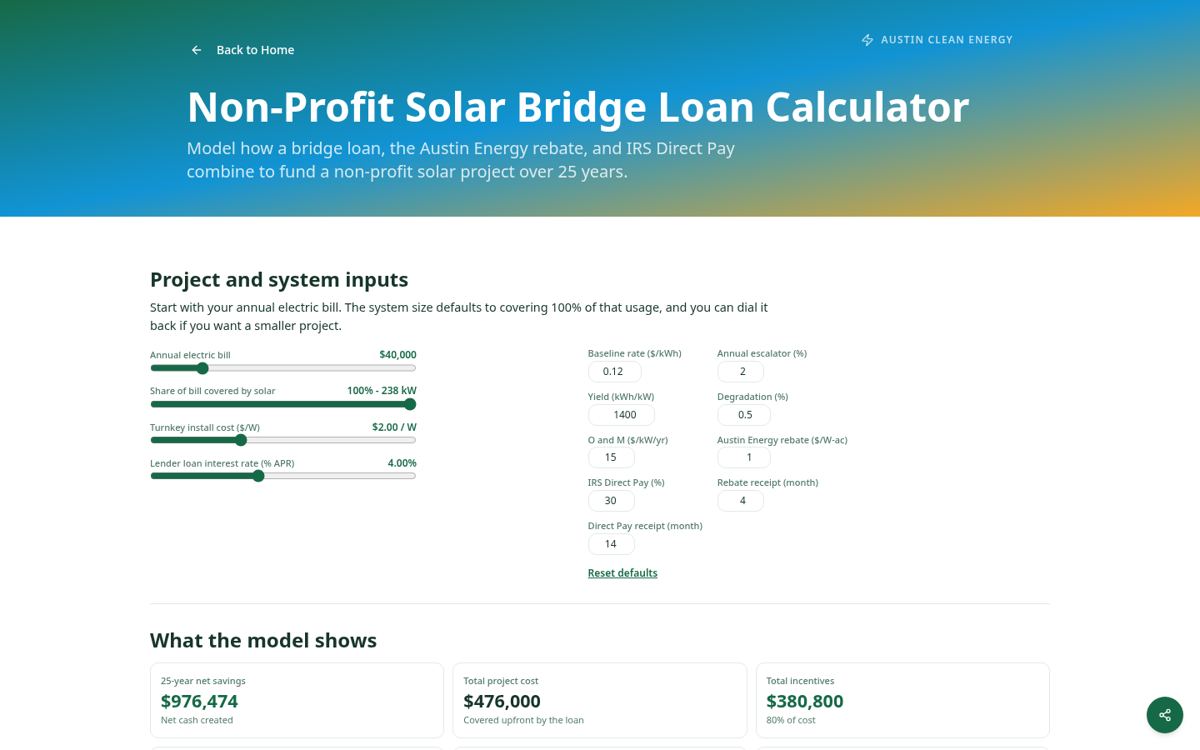
Calculate Peak ShavingModels a 25-year non-profit solar project financed by a bridge loan, repaid via the Austin Energy rebate, IRS Direct Pay, and ongoing bill savings.
Data: Austin Energy's published non-profit rebate rate + IRS Direct Pay (Section 6417) rules; everything else is an editable user assumption (bill size, install cost, interest rate).
Run Bridge Loan CalculatorUnder development
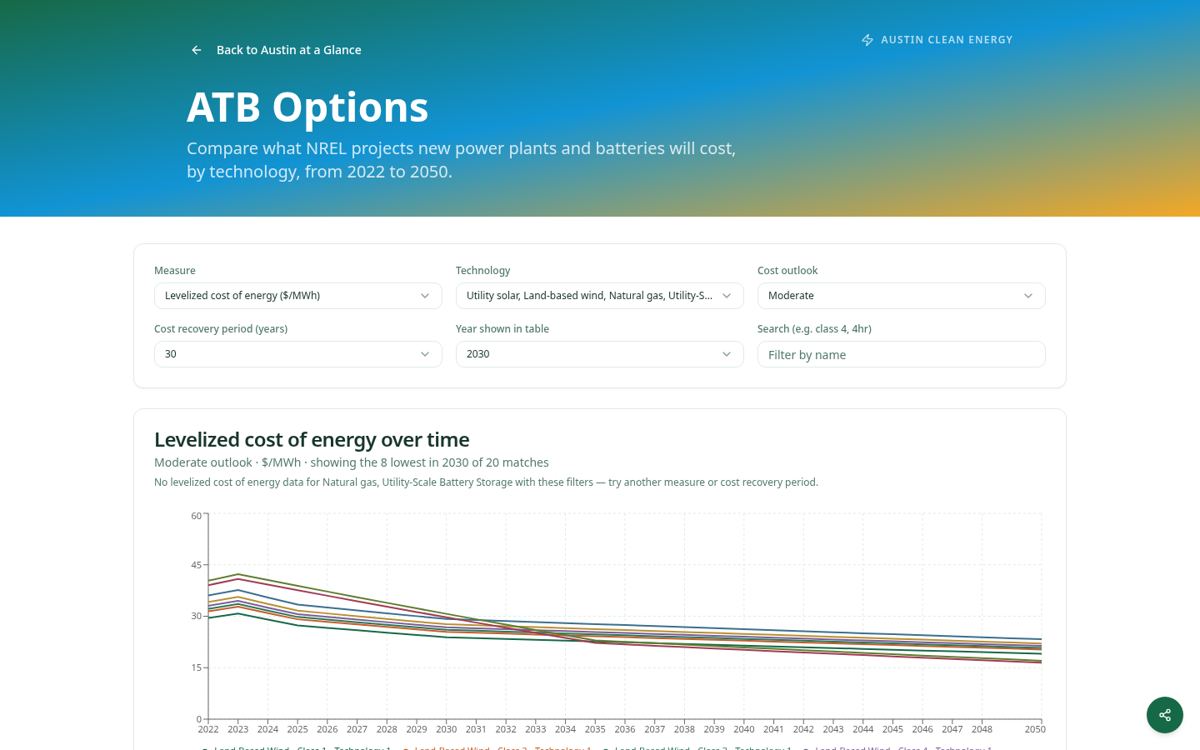
Browse and filter NREL's projected costs (LCOE, capex, and more) for solar, wind, gas, battery storage, and other technologies, 2022–2050, by cost outlook and recovery period.
Data: NREL Annual Technology Baseline (ATB) — full catalog, not a sample subset.
Browse Technology CostsIllustrative defaults
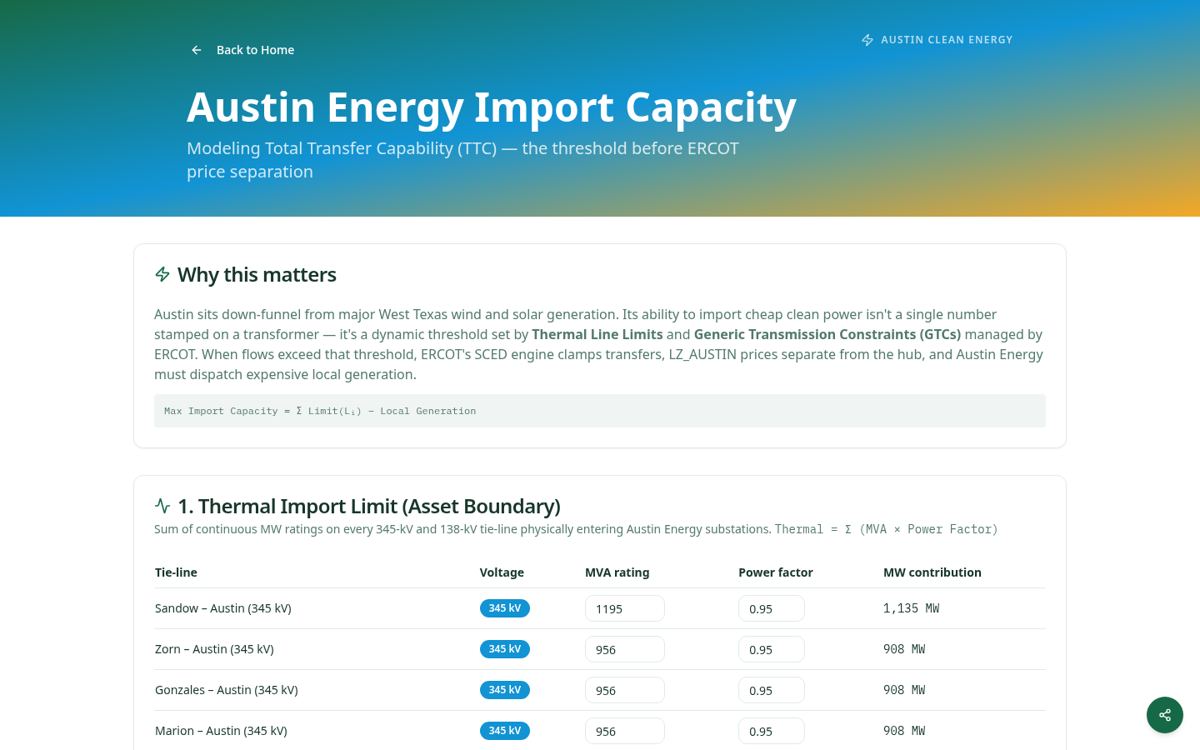
Models Austin Energy's Total Transfer Capability (TTC) — the thermal and stability (GTC) limits on importing cheap West Texas wind/solar before ERCOT price separation kicks in.
Data: Illustrative defaults pending real tie-line ratings from ERCOT's Network Operations Model / Long-Term System Assessment — flagged on the page as needing real values.
Model Import CapacityPower acquisition / Demand management / Solar siting
Compare five US grid regions by study timelines, queued capacity, and illustrative power acquisition potential.
Illustrative model · Supplied assumptions
Open toolModel a 24-hour compute load against firm grid capacity, battery dispatch, and required compute curtailment.
Illustrative model · Supplied assumptions
Open toolCompare six ISO/RTO regions by queue speed, completion rate, solar yield, permitting, and policy support. Adjust the matrix weight sliders based on current market conditions and the table sorts for the fastest States to install solar.
Illustrative model · Supplied assumptions
Open toolCOMMERCIAL DEALS & GTM & INNOVATION